
How to Describe a Bar Chart – A Comprehensive Guide to Analyzing Data
 Sarah Thompson
In short
Describing a bar chart involves analyzing and interpreting the data displayed. Learn the key steps to effectively describe bar charts for reports and presentations.

11 steps in this guide
- Identify the Variables
- Compare the Bars
- Look for Trends or Patterns
- Note Any Outliers
- Mention the Data Labels
- Provide Context
- How do I describe a bar chart in a report?
- What do the bars in a bar chart represent?
- What is the difference between a bar chart and a histogram?
- How do I interpret a bar chart?
- Can I use a bar chart for percentages?
Bar charts are one of the most effective tools for visualizing categorical data. Whether you’re working on a school project, a business report, or a research paper, knowing how to describe a bar chart is crucial for effectively communicating insights from data. In this guide, we’ll walk you through the process of describing bar charts step by step.
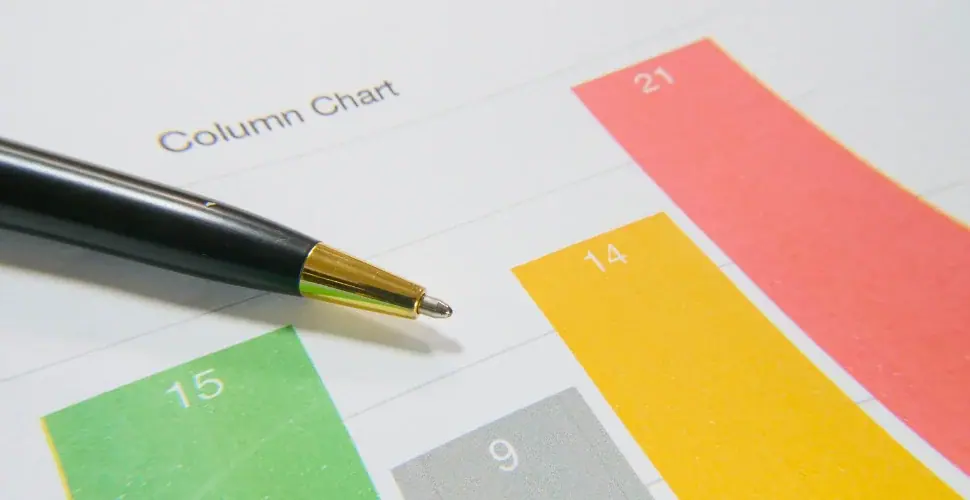
What is a Bar Chart?
A bar chart is a graphical representation of data where individual bars represent different categories. The height or length of each bar corresponds to the value or frequency of the category it represents. Bar charts can be displayed either vertically or horizontally, and they are commonly used to compare different groups or track changes over time.
How to Describe a Bar Chart
When describing a bar chart, there are several key aspects you need to focus on:
Step 1: Identify the Variables
Start by identifying the categories represented by the bars. In a typical bar chart, the x-axis will display these categories (e.g., types of products, years, or regions), while the y-axis will show the frequency, value, or percentage associated with each category.
- Example: In a bar chart comparing the sales of different products, the categories on the x-axis would be the product names, and the values on the y-axis would represent the number of units sold.
Step 2: Compare the Bars
Look at the height or length of each bar. The key to describing the chart is comparing the size of the bars. Which categories have the highest and lowest values? Do any categories stand out?
- Example: If one bar is significantly taller than the others, it indicates that the corresponding category has the highest value.
Step 3: Look for Trends or Patterns
Bar charts are useful for identifying trends or patterns in the data. Do the bars show an upward or downward trend? Are there any noticeable peaks or valleys?
- Example: If the bars show an increasing pattern over time, it suggests growth or improvement, whereas a downward trend indicates a decline.
Step 4: Note Any Outliers
An outlier is a value that is significantly higher or lower than the rest of the data. Look for any bars that deviate from the general trend.
- Example: If one bar is much taller than all the others, it may be an outlier, indicating an exceptional value or event.
Step 5: Mention the Data Labels
Describe any data labels on the bars. These labels often provide exact numerical values or percentages that can help in interpreting the chart accurately.
- Example: “The bar for Product A shows 150 units sold, while the bar for Product B shows 80 units sold.”

Step 6: Provide Context
When describing a bar chart, it’s important to consider the context of the data. What time period or location does the data represent? Is there any background information that helps explain the trends or patterns shown?
- Example: “The bar chart shows sales data for the year 2023. As shown, Product A had the highest sales during the holiday season, which is typical in this industry.”
Tips for Writing a Description of a Bar Chart
Here are some useful tips for effectively describing a bar chart in reports or presentations:
- Use Clear Language: Make sure to describe the data in simple, clear terms. Avoid technical jargon unless your audience is familiar with it.
- Highlight Key Points: Focus on the most important trends, outliers, or differences in the data.
- Be Concise: While it’s important to provide details, avoid overwhelming your audience with too much information. Stick to the most relevant points.
- Support Your Description with Numbers: Always refer to specific numbers and data points in the chart to back up your observations.
Example of a Bar Chart Description
Here’s a sample description of a bar chart:
“The bar chart displays the total sales of four products (A, B, C, and D) over the course of one year. Product A shows the highest sales with 150 units sold, followed by Product B with 120 units. Product C and D have significantly lower sales, with 80 and 60 units sold, respectively. The chart highlights a clear trend where Product A consistently outperforms the other products throughout the year.”
FAQ
Step 7: How do I describe a bar chart in a report?
In a report, describe the categories represented by the bars, compare the sizes of the bars, and highlight any trends or significant observations. Be sure to include specific numbers and provide context to help your audience understand the data.
Step 8: What do the bars in a bar chart represent?
The bars in a bar chart represent different categories or groups. The height or length of each bar corresponds to the value or frequency of that category.
Step 9: What is the difference between a bar chart and a histogram?
A bar chart represents categorical data, whereas a histogram displays the distribution of continuous data. In a bar chart, the bars do not touch, while in a histogram, the bars are adjacent to each other to represent intervals of data.
Step 10: How do I interpret a bar chart?
To interpret a bar chart, focus on the height or length of the bars to understand the values they represent. Look for trends, patterns, or outliers that can help you make sense of the data.
Step 11: Can I use a bar chart for percentages?
Yes, bar charts are often used to display percentages, particularly when comparing proportions of different categories.

Conclusion
Describing a bar chart is an essential skill for anyone working with data. By following the steps outlined in this guide, you can effectively communicate the insights displayed in bar charts. Whether you’re preparing for a presentation, writing a report, or analyzing data, a well-described bar chart can help your audience understand the data more clearly and make informed decisions.

